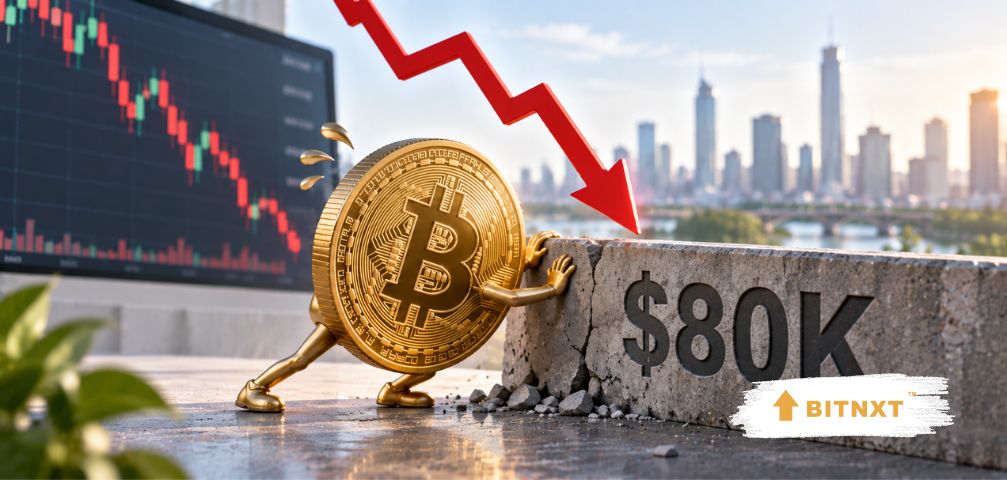
Bitcoin reclaimed $80,000 again this week. It has done that twice before this year and failed both times. The reason has almost nothing to do with crypto — and everything to do with a rate decision two weeks away.
MARKET SNAPSHOT — 4 September 2026
BTC around $81,000, up roughly 5% in 24 hours · 24h range approximately $77,000 to $81,300
Market cap around $1.63 trillion · BTC dominance around 59.7%, its highest recent level
August gain: roughly 25%, the strongest month since 2017 · Down roughly 28% from a year ago
Prices move fast. Figures below reflect the session described and will be stale within days.
On Thursday, Bitcoin went vertical. After spending the session stuck between roughly $77,200 and $78,000, it broke through $80,000 and printed an intraday high above $81,300, closing out a gain of nearly 5%.
The trigger came from Washington, not from crypto. Federal Reserve Governor Christopher Waller signalled he could support holding rates steady if August inflation data shows further cooling. Rate-hike odds for September collapsed to roughly a coin flip, the two-year Treasury yield fell after pushing above 4.40% earlier in the week for the first time since January 2025, and the dollar weakened against every G10 peer. Bitcoin did what a high-beta liquidity asset does.
This is the third assault on $80,000 in four months. The previous two both failed. Understanding why tells you more about where this market is than any price target.
The wall is real, and it has a shape
The $80,000 level is not just a round number that traders happen to fixate on. There is a genuine band of overhead supply sitting above it, and it has capped advances repeatedly.
Zone | Why it matters |
$76,800–$77,200 | The support that has repeatedly held. Cash buyers absorbed a dip to $76,567 earlier this week, with institutional bids defending the $76,000 area. |
$78,000–$80,000 | The profit-taking shelf. Sell orders in this band have been absorbing demand from investors booking gains after August’s 25% run. |
$80,000–$80,500 | The psychological and technical barrier. Reclaimed on Thursday; the question is whether it converts to support. |
$81,300–$82,500 | The late-August supply shelf, where Bitcoin was rejected twice. Analysts identify this band as capping advances in both May and August. This is the real test. |
Around $83,000 | A structural ceiling that bearish strategists align with long-term holder supply. Rejection here previously prompted warnings about a distribution phase. |
The pattern in that table is the story. Each rally has run into a progressively defined layer of sellers, and each time the buying that got it there has come from positioning rather than from sustained new demand.
Reason one: this is a rates market wearing a crypto costume
Look at the sequence over the past two weeks and the driver is unmistakable.
August delivered a roughly 25% gain, Bitcoin’s best month since 2017.
Hawkish comments attributed to Fed Chair Kevin Warsh at Jackson Hole raised the odds of a September rate increase, and Bitcoin dropped below $78,000, dragging Ethereum, Solana and XRP with it.
US airstrikes on Iranian targets sent oil sharply higher, Brent reached around $98 a barrel, the 10-year Treasury yield climbed to roughly 4.75%, and Bitcoin slipped under $76,500.
Waller cooled hike expectations, yields fell, and Bitcoin added 5% in hours.
Nothing in that sequence is about Bitcoin. Every leg was a function of real yields, energy prices and rate expectations.
Market expectations for a September hike have swung between roughly 37% and 70% within a single week before settling near 50%. An asset whose price is being set by that oscillation cannot establish a durable level, because the level is not being priced on anything endogenous to the asset.
That is the core answer to the question in the headline. $80,000 is not a price Bitcoin is failing to defend on its own merits. It is a threshold that requires a supportive rate environment to hold, and the rate environment has flipped four times in two weeks.
Reason two: the moves are leverage, not conviction
The second problem is the composition of the buying.
Thursday’s rally has been attributed primarily to short covering rather than to new leveraged long positions. Roughly $415 million in short positions were wiped out, with around $86 million liquidated within a single hour of the move.
Now look at the mirror image from earlier in the week. In one session, futures liquidations reached about $77 million with long positions accounting for roughly $70.5 million — more than 91% of the total. Over the preceding 30 days, liquidations across Binance, Bybit and OKX totalled approximately $2.36 billion, with a single event on 19 August accounting for around $691 million.
That is a market repeatedly clearing out whichever side got too crowded. Longs get flushed on a hawkish headline, shorts get flushed on a dovish one, and the price ends up roughly where it started. Bitcoin is up only around 1% on a seven-day view despite the violence of the individual sessions.
Rallies built on forced short covering have a specific weakness: the buying is mechanical and it stops. Once the shorts are gone, someone has to step in voluntarily at $81,000 for the level to hold. That has not happened yet at this price.
Reason three: supply keeps coming out of cold storage
The third headwind is the one that gets least attention. Rising exchange reserves have been flagged as a signal that the setup is getting riskier, because coins moving onto exchanges are coins positioned to be sold.
Combine that with the profit-taking dynamic after a 25% month and the structure is straightforward: there is a supply of holders who bought materially lower and are willing sellers into strength. Analysts have been explicit that without sustained institutional spot buying to clear overhead supply, price action risks turning into a distribution phase rather than a continuation.
What is genuinely supporting the price
This is not a one-sided picture, and the bear case has a real counterweight.
Corporate treasury demand continues. Strategy bought 4,603 BTC for around $370 million, part of an August aggregate of roughly $3.5 billion in corporate purchases.
Spot ETF flows have favoured Bitcoin over Ethereum, with one recent session showing roughly $101 million into Bitcoin ETFs against a $48.2 million outflow from Ethereum ETFs.
Bitcoin dominance has risen to around 59.7%, its highest recent level, as capital consolidates into BTC rather than rotating into altcoins.
Institutional infrastructure keeps expanding. Standard Chartered launched spot Bitcoin and Ether trading in the UAE, widening institutional access in a major hub.
Large holders are moving coins for custody rather than sale — Metaplanet’s transfer of more than 3,200 BTC to Coinbase Prime was a custody move, not a liquidation.
The $76,000 floor has held through an oil shock, a hawkish Fed chair and renewed Middle East hostilities. That is not nothing. The floor is being defended by real money; the ceiling is being defended by real supply. Hence the range.
What the market itself is pricing
Prediction markets are a useful reality check against the loudest voices on either side. Polymarket traders have given Bitcoin roughly a 32% chance of touching $100,000 this year, and priced Ethereum reaching $3,500 at about 31%.
Some context on where we actually are: Bitcoin is down roughly 28% from where it traded a year ago, and its all-time high above $126,000 remains a long way off. The current daily relative strength index around 72 puts it in technically overbought territory, which does not preclude further upside during a strong breakout but does argue against chasing.
The calendar that decides this
Three dates matter more than any chart pattern:
The August inflation print. Waller explicitly conditioned his dovishness on further cooling. A hot number reverses Thursday’s move.
The September FOMC decision. With odds sitting near a coin flip, this is the single largest binary event on the horizon for a high-beta asset.
The 15 September CLARITY Act cloture vote. Market structure legislation clearing its procedural hurdle would be the first genuinely crypto-native catalyst in months — and a failure would remove one.
There is also the Iran situation. Some of Thursday’s strength has been attributed to talk of winding down the conflict, and any move on oil prices feeds straight back into the inflation expectations driving the rate path.
The bottom line
Bitcoin can get to $80,000. It has done so three times. What it cannot yet do is stay there, because every visit has been powered by a rates headline and a short squeeze rather than by sustained spot demand large enough to absorb the supply sitting between $81,000 and $83,000.
For that to change, one of two things has to happen. Either the Fed takes a September hike off the table, which removes the macro overhang and lets the level convert to support. Or institutional spot buying scales up enough to clear the overhead supply outright, at which point the chart opens up towards the mid-$80,000s.
Until one of those arrives, treat $76,000 to $83,000 as the operating range and treat every violent move within it as positioning rather than repricing. The question is not whether Bitcoin can reach $80,000. It is whether anything other than the Fed can keep it there.
Important
This article is market commentary and general information only. It is not investment advice, and nothing here is a recommendation to buy or sell any asset. Cryptocurrency markets are volatile and you can lose money. All prices, levels and flow figures reflect the sessions described and will be out of date shortly after publication. Technical levels are scenarios, not forecasts. Do your own research and consider your own circumstances before making any decision.
Sources
Market data and reporting from CoinDesk, CoinGecko, Kraken, crypto.news, Coinpedia, Bitcoin.com, Fortune and CoinStats, plus prediction market pricing from Polymarket.
Bitnxt tracks exchanges, OTC desks, derivatives venues and crypto market infrastructure across the US, UK, EU and UAE. Explore the directory at bitnxt.io.